The break-even point is the level of sales where a business’s total revenue equals its total costs, resulting in neither profit nor loss. It’s the point at which all costs are covered, and no gain or loss is incurred. The break even point (BEP) is one of the most essential terms in business and finance; it refers to the level at which total revenues equal total costs. This means that neither profit nor loss is realised. Understanding the break even point is essential because businesses use it to determine how much they have to sell to break even on their costs. It also enables managers and entrepreneurs to make the correct pricing, budgeting, and financial planning decisions. This article focuses on the break-even concept, its formula, calculations, advantages, and disadvantages. Anyone working in business operations, finance, or entrepreneurship will find this comprehensive analysis to be beneficial in many respects. Knowledge about the break-even point helps in financial planning and successful strategy implementations.
What is the Break Even Point?
An integral part of the business plan is to know how much the company will have to sell to cover its fixed and variable costs. The break-even point is defined as that point where total revenues equal total costs, meaning no profit or loss is made. The break-even point thus becomes the point at which the company has neither made a profit nor incured losses. This point is the ongoing operational activity of a business whereby it has become financially self-sustainable. This is vital to the owners, managers, and investors as it shows a minimum benchmark for which one has to run a business in order not to incur losses. However, this concept of break-even is not abstract at all but has real application in pricing, marketing, and expansion on the ground level.
- Practically, organizations use the break-even point for:
- Setting sales targets and deciding on prices.
- Sizing up their cost-structure versus efficiency.
- Evaluating opportunities for investments or expansion.
Companies can know the break-even point as a measure that explains how the financial performance is affected by price, cost, or production volume. Hence, it becomes an excellent financial planning, budgeting, and strategic decision-making tool . Break even analysis is a powerful tool that allows businesses to identify the sales volume needed to avoid losses.
Break Even Point Graph
A break-even point graph is one of the best-known visualisation tools in financial planning. Formulas are critical, but many learners and professionals tend to visualise concepts. The break-even chart shows the interaction of costs, revenue, and units sold. It clearly illustrates the point at which total revenue equals total cost- the break-even point- and also delineates zones of profit and loss. It is a must-have tool for presentations, strategy meetings, and teaching needs.
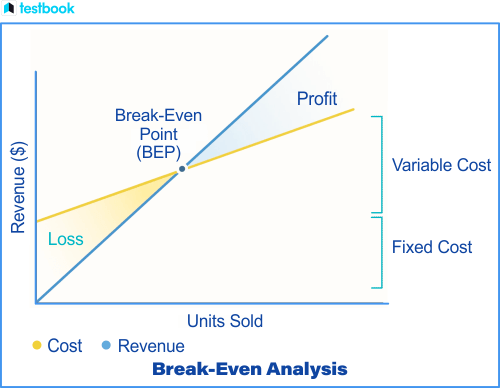
The Break-Even Chart’s Properties
We see five critical components on a break-even chart:
- Fixed Cost Line: A single straight line, as fixed costs are unchangeable irrespective of the output level.
- Total Cost Line: This is the other line that originates from the fixed costs and increases by the variable cost per unit sold.
- Revenue Line: This rises from the origin, with the slope dependent on the unit price.
- Break-even Point: This is where the revenue and total cost lines intersect.
- Profit and Loss Regions: The area to the right of the break-even point represents profits, while the area to the left represents losses.
By looking at the graph, the users immediately get an idea of the units to be sold for profits, along with how any change in costs or prices will shift the breaking point.
Break Even Point Formula
Break even in business is a critical threshold separating sustainable operations from financial risk. The break even point formula is essential for calculating how many units a business must sell to avoid operating at a loss. The break even point formula is a mathematical equation that allows companies to calculate the point at which their total revenue equals total costs. The formula is as follows:
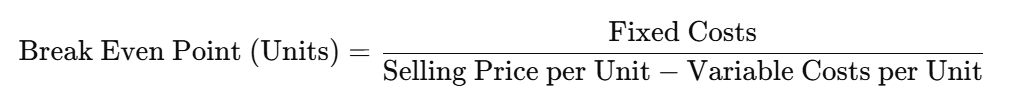
The break even point formula helps entrepreneurs determine whether their business model is financially sustainable.
This formula breaks down as follows:
- Fixed Costs: Those costs that are not changed by the number of units produced or sold. They include rent, salaries, and insurance.
- Selling Price per Unit: The amount for which the product is sold to the customers.
- Variable Costs per Unit: Those costs change with the number of units produced. These include raw materials, labour, and shipping.
This formula means that while the numerator represents the total amount a company needs to cover with its sales, the denominator represents the contribution margin per unit – the amount of money each unit contributes toward covering fixed costs after covering its own variable cost. One of the most significant advantages of the break even point formula is its simplicity and ease of application.
Let’s break down this formula with an example for clarity:
- Fixed Costs: $10,000 (rent, salaries, etc.)
- Selling Price per Unit: $50
- Variable Costs per Unit: $30
Using the formula: Break Even Point (Units)=10,000/50−30=10,000/20=500 units
This means the company needs to sell 500 units to cover its fixed and variable costs.
How to Calculate Break Even Point?
To calculate the break even point accurately, you must first distinguish between fixed and variable costs. To calculate the break even point, you must follow a simple step-by-step process that involves identifying key cost factors and inputting them into the formula. Here’s a guide on how to do it:
- Identify fixed costs: These are costs that do not change with the production volume. Examples include rent, utilities, insurance, and employee salaries. Record all expenses that would not vary with the number of units produced or sold.
- Selling Price per Unit Determination: How much do you sell it for? You must use market competition, demand, and perceived value while setting this selling price.
- Determine Variable Cost per Unit: The cost varies when the number of units produced or sold increases. This includes raw materials, direct labour costs, and shipping costs, among others. Determine how much it costs to make a single unit.
- Apply the Formula: Substitute the values for fixed costs, selling price per unit, and variable cost per unit into the break-even point formula to get the number of units you will need to sell.
For example, if your fixed costs are $12,000, your selling price per unit is $40, and your variable costs per unit are $25, the calculation would be:
Break Even Point (Units)=12,000/40−25=12,000/15=800 units
Many business owners use Excel or accounting software to calculate the break even point more efficiently. The business must sell 800 units to cover its costs and break even. You can calculate the break even point in either units or sales revenue, depending on what’s most relevant to your business model.
Benefits of Break Even Analysis
Always use up-to-date cost and price data to calculate the break even point with precision. Conducting a detailed break even analysis can highlight inefficiencies in cost structure and pricing strategies. There are various advantages associated with the break even analysis of a business. Knowing the break-even point allows organisations to decide on and improve their financial processes. Some of the significant advantages are:
- Financial planning: Break-even chart gives clear indication of when the business should start becoming profitable, and sales can then be planned to exceed that value. This way the business can make the necessary investment to expand beyond a breakeven sales level when the unit costs are met.
- Pricing decisions: When the break-even chart is properly analyzed, it helps in the understanding of the major implications of various pricing strategies. For example, if the break-even amount is very high, much too high for the level of sales management is aiming at, a company may have to reduce its price in order to compete or reduce costs if the break-even point is too high above revenues.
- Cost management: The break-even chart shows the relationship between costs and revenues, thereby giving the businesses a way to save their finance. This may mean cutting down the variable costs, negotiating a lower rental, or automating certain functions. When you calculate the break-even point on a regular basis, you are already braced up for just such cost fluctuations and other market variables.
- Profitability Forecasting: Knowing your break even point helps forecast profitability. Once sales exceed the break even point, any additional units sold directly contribute to profit. Businesses can use this insight to set profit targets. Break even analysis provides clarity when forecasting cash flow and profit margins.
- Investment Decisions: Break even analysis becomes the criterion of judgment in new investment propositions, like increasing production or launching a new product. Investors usually focus on break-even points to determine risk and the returns generated on investment. Companies that understand how to apply the break even point formula can make better-informed decisions about scaling operations.
By providing insight into how costs and revenues interact, break even analysis is a valuable tool for making informed decisions about pricing, production, and financial strategies.
Limitations of the Even Point
Break-even analysis assumes constant prices and costs despite its advantages, which may not always reflect market realities. While break even analysis is predominantly beneficial, it has limitations. In understanding this, businesses should avoid using break even analysis too extensively in their decision-making.
- Assumption of Constant Costs: Break-even analysis assumes that fixed and variable costs are constant over the entire range of production. In reality, these may vary with the increase and decrease in production. For instance, economies of scale can reduce unit costs, or higher production levels may increase variable costs due to overtime or increased supply chain expenses.
- Single Product Focus: The simple break even point formula is generally prepared for single-product companies. Companies with multiple products cannot easily calculate a single break-even point without complicated adjustments. Each product has to be analysed separately for companies with diverse product lines.
- Ignoring Market Dynamics: Break-even analysis assumes that the selling price per unit remains the same, but in a dynamic market, prices change due to competition, changes in demand, or other factors. A break-even point calculation that assumes a fixed price may not reflect real conditions.
- Over-Simplification of Costs: Break even analysis typically oversimplifies cost structures by placing costs into one of two categories: fixed or variable. Many costs do not, however, fall neatly into one of these categories. For example, some costs vary directly with production volume to some extent but are fixed over a given range of production.
- Exclusion of Non-Financial Factors: Break-even analysis focuses primarily on financial data and excludes non-financial factors such as customer satisfaction, brand reputation, or employee morale. These also affect business performance and need to be included in strategic planning.
If variable or fixed costs change, the break even point formula can be adjusted to reflect the new cost structure.
Break Even vs. Target Profit Analysis
Break even analysis is the first milestone toward financial clarity in business decision-making. Most businesses do not aim to break even; they aspire to earn profits, which is when target profit analysis comes in. Break-even analysis tells you the minimum number of units you need to sell before incurring losses. In contrast, target-profit analysis tells you how many units or revenue would be required to achieve a specific profit target. This is important for planning strategic financial goals, particularly in companies that pursue growth aggressively.
| Aspect | Break Even Analysis | Target Profit Analysis |
| Purpose | To find the point where total revenue equals total costs | To find the sales volume needed to achieve a specific profit target |
| Primary Focus | Survival — no profit, no loss | Growth — reaching a set profit objective |
| Formula (Units) | Fixed Costs ÷ Contribution Margin per Unit | (Fixed Costs + Desired Profit) ÷ Contribution Margin per Unit |
| Profit Considered? | No | Yes |
| Financial Goal | Zero profit (breakeven) | Positive profit (based on business objectives) |
| Use Cases | Cost control, minimum sales planning | Profit planning, financial forecasting, goal setting |
| Decision-Making Application | Helps avoid losses | Helps achieve income and growth targets |
| Graphical Representation | Break-even point at revenue = costs | The target profit point appears to the right of the break-even point |
| Common Use In | Startups, budgeting, and pricing analysis | Growth planning, investor presentations, and expansion modelling |
Break Even Point FAQs
1. What does it mean for a business to break even?
The break-even point is when total revenues equal costs, neither bringing profit nor loss. In this sense, it helps businesses define the minimum sales necessary to avoid losing.
2. How to arrive at a break even point?
The Break Even Point in Units = Fixed Cost ÷ (Selling Price – Variable Cost per Unit) is given by this formula. In other words, it tells you the number of units that must be sold to cover all fixed and variable expenses.
3. What is the utility of breakeven analysis?
It makes sales goals, cost management, and pricing strategies possible. In addition, break-even analysis gives users the power to make investment and expansion decisions.
4. Can a business have more than one break even point?
Affirmatively, especially with multiple products or ever-changing costs and prices. Every product or pricing model may have its specific break-even point.
5. What happens after the break-even point?
After the break-even point, any unit sold generates profit directly since all fixed costs are already covered.