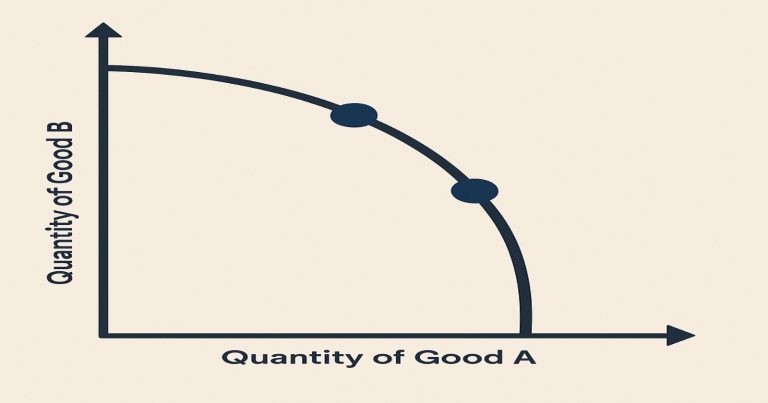
A production possibility curve is the most basic form of economic modeling that illustrates the most efficient uses of productive inputs between producing two different goods or services. The curve represents a graphical expression of the trade-offs, the opportunity cost involved, and the maximum production possibilities that an economy can make with resources in hand and technology available. The PPC helps improve the understanding of what scarcity and efficiency mean for choice while being oriented toward maximum output in any economy.
What is Production Possibility Curve?
The PPC, or production possibility frontier, represents the combinations of two goods or services an economy can produce, given limited resources and fixed technology. It demonstrates the boundary between what is attainable and what is unattainable concerning production.
Key Features of the PPC
- Resource Allocation: The PPC highlights how limited resources can be allocated between competing needs.
- Efficiency: Points on the curve represent maximum efficiency, where resources are fully utilized.
- Opportunity Cost: It demonstrates the cost of producing one good in terms of the other that must be given up.
- Limits of Production: The PPC defines the maximum potential output given the current resources and technology.
Assumptions of the PPC
To simplify the concept, the PPC relies on certain assumptions:
- Fixed Resources: The amount of land, labor, capital, and other inputs remains constant during the analysis.
- Unchanging Technology: Production methods do not improve or change.
- Two-Good Economy: The PPC assumes only two goods are being produced, simplifying the trade-off analysis.
- Full Utilization: All resources are employed efficiently, with no wastage.
How Production Possibility Curve Work?
The concept of a production possibility curve works to outline the trade-offs faced by an economy for choosing which goods or services it is to produce. It shows how resources are scarce and something must be given up to achieve the best.
- On the Curve: The points on the PPC indicate that resources have been used efficiently. The economy is functioning at full capacity.
- Inside the Curve: Points inside the PPC represent inefficiency, such as unemployment or underutilization of resources.
- Outside the Curve: The Points outside the PPC are unachievable with the existing resources and technology.
Shape of the PPC
The PPC is generally downward-sloping to the origin because of the law of increasing opportunity cost. That is to say, as more resources are shifted from one good to another, then the cost of reallocation of resources rises.
Linear PPC
In a few cases, the PPC is a straight line that shows constant opportunity cost. This is when resources use equal efficiency in producing both goods.
- Example: A hat and scarf factory using the same inputs may not reflect an increase in opportunity cost and thus have a linear PPC.
Shifts in the PPC
The PPC can expand either outward or inward depending upon the changes in the availability of resources or technological revolutions.
- Outward Shift: Indication of economic growth as more goods are produced because Resource increases, such as labor, land, or capital. Technological advances that increase productivity.
- Inward Shift: Indicates a decline in production capacity due to: Natural disasters, Resource depletion or loss, and Economic crises reducing resource availability.
Opportunity Cost & Trade-Offs
The PPC has an emphasis on opportunity cost, which is the value of the next best alternative foregone. It underlines the trade-offs that emerge when reallocation is carried out between two goods.
- Example: A country that has produced 50 units of food and 30 units of clothing decides to produce 70 units of food, reducing the production of clothing to 20 units. The lost 10 units of clothing represent the opportunity cost.
Purpose of Production Possibility Curve
The purpose of the production possibility curve is to help understand and illustrate the economic choices, efficiency, and challenges toward resource allocation that face an economy. Below is a detailed explanation of its various purposes:
Understanding Efficiency
The PPC helps evaluate whether an economy is working efficiently.
- Effective Resource Utilization: Points on the curve are situations where all resources are made effective to produce the maximum possible output.
- Inefficiency Indicators: The points within the curve indicate inefficiency, for instance, unemployments high and resource wastage. A policymaker can identify these inefficiencies and eliminate them to increase productivity.
Analyzing Opportunity Cost
The PPC is a powerful tool for visualizing opportunity costs—the value of the next best alternative forgone when making a choice.
- Example: A country deciding between producing more military equipment or consumer goods can use the PPC to analyze the trade-offs involved and understand the cost of prioritizing one over the other.
Assessing Economic Growth
The PPC shows how an economy expands or contracts over time, which is reflected by changes in production capability.
- Outward Shifts Indicate Growth: Such shifts advocate for improvements resulting from technological advancements, better education, or improved resource availability.
- Inward Shifts Reflect Decline: May emanate from resource loss, natural disasters, or economic instability.
- Example: Introducing high-tech agricultural technology can extend the PPC outwardly for agricultural products, expanding the capacity of production.
Guiding Decision-Making
The PPC serves as a decision-making tool for businesses, governments, and policymakers.
- For Governments: The PPC helps determine resource allocation priorities, such as focusing on healthcare versus infrastructure development.
- For Businesses: Companies can use the PPC to allocate resources efficiently between different products or services.
- Example in Policy: During a national crisis, a government may decide to allocate more resources to healthcare over luxury goods, using the PPC to evaluate the trade-offs.
Highlighting Scarcity & Trade-Offs
PPC focuses on how scarce resources affect decisions related to production. It demonstrates how an economy must make choices and trade-offs to achieve its objectives.
- Example: A developing country with limited resources might prioritize producing food and housing over luxury items. The PPC visually represents this trade-off.
Comparing Economic Systems
It can be used to compare different economies or economic systems. The PPC represents how efficiently resources are used and what types of industries are favored.
- Example: A market economy may have a different PPC outcome compared to a centrally planned economy due to the differences in resource allocation strategy.
Conclusion
The PPC is important for understanding resource allocations within an economy, economic efficiency, and the trade-offs involved. From the analysis of the PPC, businesses, and policymakers can make decisions between conflicting priorities and take the right opportunity to scale up production. Producing more of one good as opposed to another is limited, but opportunities still exist for growth and improvement through a PPC. It still is an important tool in addressing scarcity optimizing resource use and achieving sustainable development.
Production Possibility Curve FAQs
What is the production possibility curve?
The production possibility curve (PPC) shows the maximum combinations of two goods an economy can produce using its available resources and technology.
What do points inside and outside the PPC mean?
Points inside the PPC imply inefficiency whereas points outside the curve are unattainable with currently available resources and technology.
What causes shifts in the PPC?
Changes are caused by resource differences, new technology, or economic shocks. Expanding outward represents growth, whereas shrinking inward is a sign of decline.
How does the PPC illustrate opportunity cost?
The PPC illustrates opportunity cost with the example of the trade-off between two goods. More of one good’s production leads to some loss of the other.
Why is the PPC useful for policymakers?
Policymakers apply the PPC to analyze trade-offs, give priorities, and formulate policies toward efficient resource allocation and economic growth.


