Karl Pearson coefficient of correlation is a statistical measure that measures the type and strength of a linear relationship between two variables. One of the commonly used correlation coefficients in statistics, it was developed by Karl Pearson. It falls in the range of -1 to +1. The value of +1 can perfectly indicate a positive linear relationship, while -1 marks a perfect negative linear relationship, and 0 signifies no linear relationship whatsoever.
This article explains the concept of correlation coefficients, introduces the formula for Karl Pearson’s coefficient of correlation, and discusses the different methods of calculating such.
What Do You Mean by Correlation Coefficient?
A correlation coefficient is a measure of how much two variables move about each other. It helps understand the strength and direction of a linear relationship between two variables. The correlation coefficient can be positive, negative, or zero:
- Positive Correlation: As one variable increases, the other also increases.
- Negative Correlation: As one variable increases, the other decreases.
- Zero Correlation: No consistent pattern between the variables.
Karl Pearson’s coefficient of correlation, often symbolized as r, specifically measures the linear correlation between two variables.
Karl Pearson Coefficient of Correlation
The Karl Pearson coefficient of correlation is a statistical formula that defines the relationship between two continuous variables. This method is mostly applied when both variables are measured on an interval or ratio scale; hence, it is ideal for variables that are continuous and normally distributed.
The Pearson correlation coefficient provides insights into two major factors:
- Strength of Relationship: How strong the linear relationship is between two variables.
- Direction of Relationship: Whether the relationship is positive (both variables move in the same direction) or negative (variables move in opposite directions).
Characteristics of Pearson’s Coefficient:
- Range: It ranges from -1 to +1.
- +1: Perfect positive correlation.
- -1: Perfect negative correlation.
- 0: No linear correlation.
- Linear Relationship: It measures only the linear relationship between two variables, not nonlinear patterns.
Karl Pearson’s Coefficient of Correlation Formula
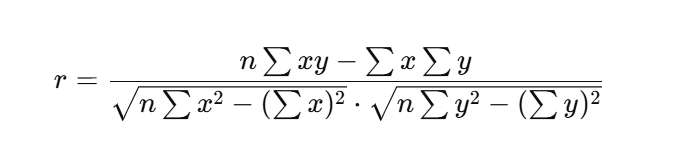
The formula for calculating the Karl Pearson coefficient of correlation is as follows:
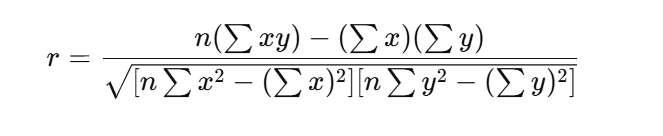
Where:
- r = Karl Pearson coefficient of correlation
- x and y = Variables being compared
- n = Number of pairs of scores
- sum xy = Sum of the product of paired scores
- sum x and sum y = Sum of the individual scores of x and y, respectively
- sum x^2 and sum y^2 = Sum of the squares of x and y scores
Methods of Calculating Karl Pearson’s Coefficient of Correlation
There are several ways to compute the Karl Pearson coefficient of correlation. Each of these modes makes computation easier using whichever data or information is available. The most commonly discussed methods are those below:
1. Actual Mean Method
In the Actual Mean Method, the mean (average) of both variables is calculated. The deviations of each observation from the mean are used to compute the coefficient.
Formula:
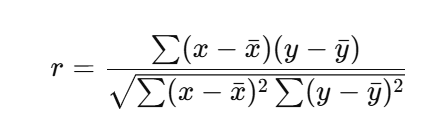
Where:
- x and y are the means of the x and y variables, respectively.
This method is precise but involves many calculations when working with large datasets.
2. Direct Method
In the Direct Method, we avoid calculating the mean explicitly. Instead, the entire formula is applied to estimate the correlation directly from the values of x and y.
Formula:
This method is quicker for smaller datasets but may become cumbersome for larger data sets due to the numerous steps involved.
3. Short-Cut Method / Assumed Mean Method
The Short-Cut Method simplifies the process of calculating deviations by using an assumed mean for both variables. The deviations from this assumed mean are then calculated, reducing the computational effort.
Formula:
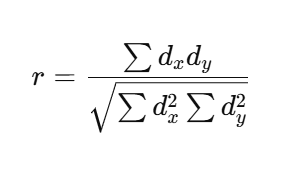
Where:
- (d_x) and (d_y) are deviations of x and y from their assumed means.
This method is widely used in practice due to its simplicity and efficiency.
4. Step Deviation Method
The Step Deviation Method is a further extension of the Short-Cut Method. It further reduces the computation by the common factor: deviations are divided by it. This common factor could be the width of the class intervals if the data is grouped.
Formula:
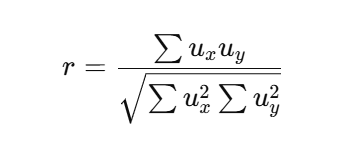
Where:
- (u_x) and (u_y) are the step deviations of x and y.
Use of Karl Pearson’s Coefficient of Correlation
The Karl Pearson coefficient of correlation is a versatile tool used across various fields for different purposes. Here are some of its primary applications:
1. Finance: Pearson’s coefficient helps break down the interlinkage between various assets in finance. For example, it may indicate whether the stock price of two companies moves together or in isolation.
2. Economics: Economists use the method to study variables ranging from demand and price, income and expenditure, to inflation and unemployment. In correlation, one can bring out the link that exists between one economic factor and another.
3. Social Sciences: Social science researchers use the Pearson coefficient to calculate the correlation of other variables: age and income, a degree, the rate of employment, or class and health considerations.
4. Medicine and Biology: In medicine and biology, such a correlation helps determine relationships between other factors, such as treatment and influence on recovery, or frequency of exercise and cholesterol levels.
One of the most popular statistical tools used in measuring the linear relationship that may exist between two variables is known as the Karl Pearson coefficient of correlation. The use can be seen in applications such as areas like finance, economics, biology, and the social sciences because it is convenient to interpret. Noting how two variables relate to each other helps in making predictions or decisions with the information available. Whether it is stock prices or medical data, this coefficient gives an excellent insight regarding the degree and direction of the relationship.
Karl Pearson Coefficient of Correlation FAQs
What is the main purpose of Karl Pearson’s coefficient of correlation?
Karl Pearson’s coefficient of correlation is used to measure the strength and direction of the linear relationship between two continuous variables.
How does Karl Pearson’s correlation differ from Spearman’s correlation?
Karl Pearson’s correlation measures linear relationships, while Spearman’s correlation measures the rank-order or monotonic relationship between variables, making it suitable for ordinal data.
What is a good Pearson correlation coefficient?
A Pearson correlation close to +1 or -1 indicates a strong linear relationship. A value near 0 suggests little to no linear relationship.
Can the Pearson coefficient be used for non-linear data?
No, the Pearson coefficient only measures the strength of a linear relationship. For non-linear data, other methods like Spearman’s rank correlation are more appropriate.
What are the limitations of using Karl Pearson’s coefficient of correlation?
Pearson’s coefficient assumes linearity, normal distribution of variables, and homoscedasticity (equal variance). If these assumptions are violated, the results may not be valid.