
Technical analysis in financial markets enables traders to respond to price movements predicted by previous market data. Charts, patterns, and indicators are the methods to establish market trends and make informed trading decisions. While fundamental analysis assesses a trader’s financial condition, only technical analysis looks at current price action or volume. A trader supports his entry and exit decision using technical analysis tools, technical analysis indicators, technical analysis strategies, and technical analysis patterns. The technical analysis software helps automate and optimise accuracy.
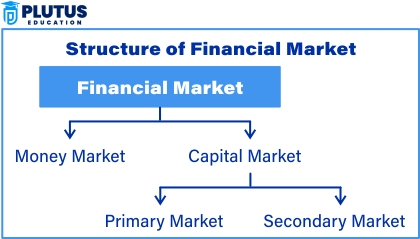
What is Financial Market?
A financial market is a trading place where buyers and sellers transact in financial assets like stocks, bonds, currencies, and commodities. It allows funds circulation among investors, businesses, and governments to establish capital and economic growth. Financial markets are divided into various types: stock market, bond market, forex market, and derivatives market. These operate through exchanges or over-the-counter platforms, assuring liquidity and fair pricing. Investors use technical and fundamental analysis strategies to find trading opportunities and maximise returns while managing risk.
Technical Analysis of Financial Markets
Technical analysis tools help traders analyse price data and identify trading opportunities. Such tools facilitate the identification of trends, volatility, momentum, and price reversals. The use of appropriate tools would enhance the probability of generating profitable trades. Traders will employ many tools to present the overall picture of the markets more clearly.
Charting Tools
Charting tools represent past price behaviour in graphic form. Charts allow traders to identify patterns and trends quickly. The most popular charts include candlestick, bar, and line charts. Of the three, candlestick charts are the favourite because they encompass open, high, low, and close in one bar.
Trend Lines and Support & Resistance Levels
Trend lines indicate the general direction a market is taking. If prices are moving up, the trend is bullish; if prices are moving down, the trend is bearish. A support level is where, according to traders, the price may stop falling, whereas a resistance level is where the price may stop rising. Traders integrate these levels into their plans.
Volume Indicators
Volume indicators indicate the number of shares or contracts traded in a given period in a market. In high volume, a strong trend is confirmed, while in low volume, a weak trend is identified. Some traders use the On-Balance-Volume (OBV) measure to ascertain whether buying or selling pressure is gaining momentum.
Moving Averages
Moving averages smooth price data to indicate trends in a particular period. Simple moving average (SMA) and exponential moving average (EMA) are the main two types. Traders use these two to determine whether a stock is in an upward or downward trend.
Technical Analysis Indicators
Technical indicators are mathematical price and/or volume functions that provide information concerning market conditions. Variables used to determine forecasted prices are confirmation of trends, uptake of momentum, and price prediction.
Momentum Indicators
Momentum indicators refer to the speed or velocity of price movements. One of the well-known momentum indicators is the Relative Strength (RS) index, which expresses itself in a range of 0-100. An RS above 70 means the asset is overbought; below 30 means the asset is oversold.
MACD helps make money by discovering the momentum change. The MACD consists of moving averages of two lines—the MACD line and the signal line. A buy signal is given when the MACD line crosses above the signal line and vice-versa for sell.
Bollinger Bands
Bollinger Bands measure the volatility of the market. It comprises three bands: the middle band (SMA), the upper, and the lower band. The upper band represents overbought conditions, and the lower represents oversold conditions.
This indicator compares a security’s closing price with its high-low range over a specified period. Any value above 80 indicates overbought conditions, whereas below 20 indicates sold conditions. Traders use this to identify possible trend reversals.
Average True Range (ATR)
Average True Range (ATR) measures the degree of volatility. A consistently high ATR means prices move sharply, while a low ATR indicates a less active market. Traders would use ATR to set stop losses.
These technical analysis strategies help traders make the most profitable decisions during trades. These strategies determine entry and exit points based on price action, trends, and volumes.
Trend Following Strategy
Trend following strategy follows the path of the market. They buy when the price goes up; when the price goes down, they sell. Trend confirmation involves moving averages, trend lines, and RSI.
Breakout Traders
Breakout traders guard the market when the price crosses a key support or resistance level. The breakout above resistance represents a buying opportunity, while the breakout below support represents a selling opportunity.
Swing Traders
Swing traders hold their positions for several days to capture short- to medium-term price movements. They identify key entry and exit points based on chart patterns and technical indicators.
Scalping
On the other hand, Scalping would continuously seek to exploit tiny price moves by taking quick advantages in individual trades, which could last from seconds to minutes.
Mean Reversion Strategy
The mean reversion strategy assumes that prices will return to their historical average at some point. Therefore, it holds that the trader should look for trades that consider an asset’s recent movement away from this average.
Technical Analysis Patterns
Technical analysis patterns are indicators of movement anticipated in price changes. These constructs are repeated in the price charts to enable the trader to predict future price flow.
Continuation Patterns
Continuation patterns depict how the market would be operational after a brief surfacing. Examples are flags, pennants, and triangles.
- Flag Pattern – A small rectangle created following a sharp price movement. It signals that the trend will continue.
- Pennant Pattern – A small symmetrical triangle that forms after a substantial price movement. This pattern signifies that the trend will continue.
- Triangle pattern – This is one feature that has converging trend lines. Price break-out continues in the direction of the breakout.
Reversal Patterns
Reversal Patterns will indicate that the market trend will change over time. Common Examples are Head and Shoulders, Double Tops, and Double Bottoms.
- Head and Shoulders– This is a bearish reversal pattern created after an uptrend. It indicates a trend reversal.
- Double Top: It is a bearish pattern formed when the price touches a high twice and subsequently declines.
- Double Bottom– This pattern is bullish and is formed when the price declines to a low twice and then upsurges.
Candlestick patterns
Candlestick patterns portray market sentiment. Typical patterns include:
- Doji – which implies indecision in the market. Opening and closing are nearly the same.
- Hammer – A typically bullish reversal candle, this formation suggests a rice upsurge after a downward trend.
- Shooting Star: A bearish reversal pattern indicates a price decrease in an increasing trend.
Relevance to ACCA Syllabus
Technical analysis is the most critical part of ACCA’s financial management and risk analysis, and it involves investment appraisal techniques, financial market behaviour, and portfolio management. This understanding of technical analytical skills makes it easier for ACCA professionals to interpret market movements for investment decisions and hedging strategies.
Technical Analysis of the Financial Markets ACCA Questions
Q1: What is the primary assumption of technical analysis?
A) Market prices follow a random pattern
B) Fundamental factors drive price movements exclusively
C) Historical price movements can predict future price trends
D) Markets are always efficient and cannot be analysed
Ans: C) Historical price movements can predict future price trends
Q2: Which of the following is a commonly used momentum indicator in technical analysis?
A) Moving Average
B) Relative Strength Index (RSI)
C) Price-to-Earnings Ratio (P/E)
D) Discounted Cash Flow (DCF)
Ans: B) Relative Strength Index (RSI)
Q3: A head and shoulders pattern in a price chart indicates:
A) A bullish trend continuation
B) A reversal of a trend from bullish to bearish
C) No impact on market direction
D) A consolidation phase before a breakout
Ans: B) A reversal of a trend from bullish to bearish
Q4: What does a rising wedge pattern typically indicate?
A) Bullish continuation
B) Bearish reversal
C) No change in trend
D) Increasing market stability
Ans: B) Bearish reversal
Q5: In technical analysis, what does a support level represent?
A) The lowest price stock is expected to fall to before bouncing back
B) The highest price a stock is expected to reach before declining
C) The midpoint of a stock’s historical price movement
D) A random price level without significance
Ans: A) The lowest price a stock is expected to fall to before bouncing back
Relevance to US CMA Syllabus
The CMA syllabus covers financial planning and analysis, which includes investment decision-making and market behaviour. Technical analysis applies to analysing securities and understanding price trends, which aids in strategic financial management.
Technical Analysis of the Financial Markets CMA Questions
Q1: What is the primary purpose of technical analysis for financial managers?
A) Identifying overvalued assets using balance sheet data
B) Evaluating the intrinsic value of a security
C) Forecasting future price movements based on historical data
D) Determining taxation strategies for investments
Ans: C) Forecasting future price movements based on historical data
Q2: The Moving Average Convergence Divergence (MACD) indicator is used to:
A) Measure company profitability
B) Identify trends and potential reversals
C) Calculate the net present value of investments
D) Compare financial ratios
Ans: B) Identify trends and potential reversals
Q3: What does a bearish divergence in RSI indicate?
A) A potential downward reversal in price
B) A continuation of the uptrend
C) No significant price movement
D) A bullish breakout
Ans: A) A potential downward reversal in price
Q4: A “golden cross” in technical analysis occurs when:
A) A short-term moving average crosses above a long-term moving average
B) A stock price hits a new 52-week low
C) Market volatility decreases significantly
D) A company declares dividends
Ans: A) A short-term moving average crosses above a long-term moving average
Q5: The Bollinger Bands indicator helps traders measure:
A) Market volatility
B) Dividend payout ratios
C) Economic growth rate
D) Business cycle stages
Ans: A) Market volatility
Relevance to US CPA Syllabus
The CPA exam includes financial planning, investment strategies, and risk management. Technical analysis is helpful for CPAs in auditing, financial statement analysis, and understanding stock market behaviour.
Technical Analysis of the Financial Markets -CPA Questions
Q1: What does a “double bottom” pattern in technical analysis indicate?
A) A continuation of the current trend
B) A potential reversal from a downtrend to an uptrend
C) A consolidation phase in the market
D) An increase in market liquidity
Ans: B) A potential reversal from a downtrend to an uptrend
Q2: Which of the following is NOT a typical chart pattern in technical analysis?
A) Cup and Handle
B) Double Top
C) Moving Average Costing
D) Ascending Triangle
Ans: C) Moving Average Costing
Q3: What is the significance of the Fibonacci retracement levels in technical analysis?
A) They help determine potential support and resistance levels
B) They measure company profitability
C) They assess inflation’s impact on investments
D) They forecast annual revenue growth
Ans: A) They help determine potential support and resistance levels
Q4: Which of the following indicators is a measure of market momentum?
A) Price-to-Book Ratio
B) Moving Average
C) Stochastic Oscillator
D) Earnings Per Share (EPS)
Ans: C) Stochastic Oscillator
Q5: In a candlestick chart, a long upper shadow and small body indicate:
A) Strong bullish sentiment
B) Reversal to a bearish trend
C) Price stability
D) Market inactivity
Ans: B) Reversal to a bearish trend
Relevance to CFA Syllabus
The CFA syllabus covers investment management, portfolio strategies, and financial markets. Technical analysis is crucial for analysing security price trends and making informed investment decisions.
Technical Analysis of the Financial Markets CFA Questions
Q1: Which of the following is NOT a basic assumption of technical analysis?
A) Market trends persist over time
B) Prices reflect all available information
C) Historical data can predict future price movements
D) Markets always operate with perfect efficiency
Ans: D) Markets always operate with perfect efficiency
Q2: Which technical analysis tool measures overbought or oversold conditions?
A) Relative Strength Index (RSI)
B) Current Ratio
C) Debt-to-Equity Ratio
D) Book Value Per Share
Ans: A) Relative Strength Index (RSI)
Q3: The “death cross” in technical analysis refers to:
A) A short-term moving average crossing below a long-term moving average
B) An indication of a company’s insolvency
C) A bullish reversal pattern
D) A high trading volume day
Ans: A) A short-term moving average crossing below a long-term moving average
Q4: Which chart pattern is typically associated with trend continuation?
A) Symmetrical Triangle
B) Double Top
C) Head and Shoulders
D) Engulfing Pattern
Ans: A) Symmetrical Triangle
Q5: What does a breakout above resistance indicate in technical analysis?
A) Continuation of an upward trend
B) Imminent reversal to a downward trend
C) No significant impact on price movement
D) Decrease in market liquidity
Ans: A) Continuation of an upward trend