The demand curve slopes downward to represent the inverse relationship between the price of a product and the quantity demanded. In economics, the demand curve is a graphical representation that shows how the quantity of a good or service demanded changes with varying prices. Typically, as the price decreases, the quantity demanded increases, resulting in a downward-sloping demand curve. The entire underpinnings of the law of demand come into play in this relationship. The purchasing behavior of a consumer varies quite a lot here and there along the line as prices change from one level to another. In quite a rudimentary sense, if one understands why the demand curve slants downward, the supply-and-demand mechanism in the market economy needs no extra explanation.
What is a Demand Curve?
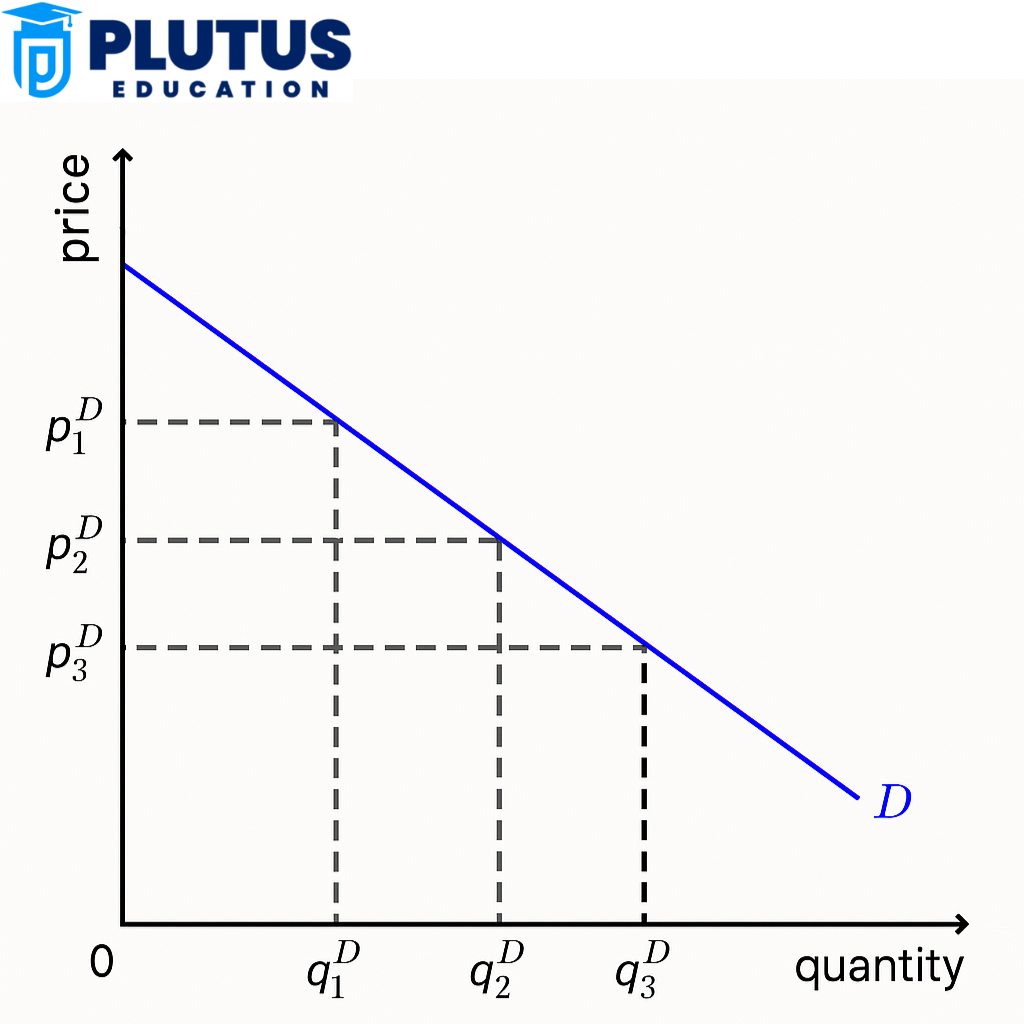
The demand curve is a graph that shows the relationship between the price of a product and the quantity of that product consumers are willing to purchase at different price levels within a specific period. This curve helps economists, businesses, and students visualize consumer behavior.
On a standard graph, the horizontal axis (X-axis) represents the quantity demanded, while the vertical axis (Y-axis) shows the price of the product. The demand curve typically slopes downward from the upper left to the lower right, which means that as the price decreases, the quantity demanded increases, and vice versa.
This visual representation helps us understand how consumers make purchasing decisions. For example, if the price of rice drops from ₹80/kg to ₹50/kg, many families will start buying more rice. This is because it becomes more affordable, and they may even substitute rice for other expensive grains. Therefore, the demand curve captures this inverse relationship between price and demand in a graphical form.
In real-world usage, demand curves help set prices, forecast sales, and make business decisions. The government also uses them to decide taxes, subsidies, and minimum support prices for essential goods.
Why Does the Demand Curve Slope Downward?
The demand curve slopes downward due to a principle in economics called the Law of Demand. This law states that all other things are equal; when the price of a product falls, the demand for that product increases. This happens because of several logical reasons tied to consumer behavior: income effect, substitution effect, and utility.
Law of Diminishing Marginal Utility
The first and most basic reason is the Law of Diminishing Marginal Utility. This means that the more of a good a person consumes, the lesser satisfaction they get from each additional unit. For example, the first roti, when you’re hungry, gives you great satisfaction. The second roti gives slightly less satisfaction, and by the fifth, you’re barely interested. So, a consumer will only buy more if the price goes down enough to make it worthwhile.
Substitution Effect
The substitution effect occurs when a product’s price falls, making it cheaper than its alternatives. Consumers then switch to the cheaper product. For instance, if the price of coffee falls while the price of tea remains the same, some tea drinkers may switch to coffee because it’s now a more cost-effective option.
Income Effect
The income effect refers to the increased purchasing power consumers feel when prices fall. With the same income, they can now buy more goods. So, they tend to purchase more, not just cheaper products but possibly other goods as well. This increase in real income results in higher demand.
More Buyers Entering the Market
Lower prices can also attract new buyers who couldn’t afford the product before. When a product becomes affordable to a larger group of people, total demand in the market increases, pulling the demand curve downward.
Bulk Purchasing by Existing Consumers
Most of the time, buying in bulk is a trend among Indian households when there is a discount during some sales or festivals. They do this with grains, oil, or packaged food items, with the understanding that such things can be stored and used well into the future. Thus, falling prices will increase demand for such items.
Together, these effects explain the natural downward slope of the demand curve and why people are more likely to buy more when prices fall.
Exceptions to the Downward Sloping Demand Curve
Although the law of demand generally holds, there are several exceptions where the demand curve does not slope downward. These exceptions show us that consumer behavior is not always predictable and may depend on psychological, social, or market-based factors.
Giffen Goods
Giffen goods are a special type of inferior goods named after the economist Sir Robert Giffen. These goods defy the law of demand. When the price of such goods increases, people actually buy more of them. This happens mainly among low-income groups. For example, if the price of coarse rice increases, low-income families may not be able to afford vegetables or better grains anymore. So they spend even more on coarse rice despite the higher price.
Veblen Goods
Veblen goods are luxury items that become more desirable as their price increases. This is because they are considered status symbols. In many urban Indian areas, high-priced goods like Rolex watches, luxury cars, or designer clothes are demanded more when their prices rise because buyers associate price with prestige.
Necessity Goods
Some goods are essential for daily living, such as salt, medicine, or electricity. No matter what the price is, people have to buy them. The demand remains constant even if the price increases or decreases, showing a perfectly inelastic or nearly vertical demand curve.
Speculative Goods
Sometimes, people buy more of a product because they believe its price will rise further. This is common in the case of stocks, gold, or real estate. Even if the current price is high, people continue to buy, expecting a profit later. This behavior goes against the traditional demand pattern.
Emergency or Panic Situations
In times of crisis or panic, such as during a natural disaster or pandemic, demand for certain goods increases regardless of price. During COVID-19, for instance, people rushed to buy sanitizers and masks even when prices were high. This exception is based more on fear and urgency than price logic.
These exceptions are important to understand because they show that demand is influenced by many real-life factors beyond just price.
Characteristics of Downward Sloping Demand Curve
The downward-sloping demand curve has certain distinct features that are consistent across various goods and services in a typical market. These characteristics help us identify and understand how demand behaves under normal conditions.
Negative Slope
The most defining feature of a downward-sloping demand curve is that it slopes from the upper-left corner to the lower-right corner. This visual representation shows that price and demand move in opposite directions.
Inverse Relationship Between Price and Quantity Demanded
The curve clearly demonstrates the inverse relationship — as price goes up, demand goes down; as price goes down, demand goes up. This relationship is the backbone of microeconomic theory.
Convex Shape
Due to the law of diminishing marginal utility, the curve is generally convex to the origin. This means the demand doesn’t increase at the same rate every time the price drops because each additional unit gives less satisfaction.
Based on Ceteris Paribus
The demand curve assumes that all other factors remain constant (income, taste, price of other goods, etc.). This is referred to as the ceteris paribus assumption, without which the curve wouldn’t be reliable.
Movement Along the Curve vs Shift of the Curve
A change in price causes a movement along the demand curve. If any other factor, like income or preference, changes, the entire curve shifts either to the right (increase in demand) or to the left (decrease in demand).
Applicability to Normal Goods
The downward slope applies mostly to normal goods, which are items that people buy more of when they have more money and less when prices rise.
These features not only define the demand curve but also make it a powerful tool for analyzing consumer markets and forecasting demand.
Downward Sloping Demand Curve FAQs
1. Why does the demand curve slope downward?
The inverse relationship between price and quantity demanded is explained through the substitution effect, income effect, and diminishing marginal utility.
2. What are Giffen goods, and how are they an exception?
Giffen goods are inferior goods where demand rises as price rises, especially among low-income buyers due to a lack of alternatives.
3. What is the substitution effect in a demand curve?
It refers to the tendency of consumers to switch to cheaper alternatives when a product’s price falls, increasing its demand.
4. What are Veblen goods?
Luxury items whose demand increases with price due to their status value — examples include high-end fashion and luxury cars.
5. Can the demand curve ever slope upward?
Yes, in special cases like Veblen or Giffen goods, the curve can slope upward due to non-price factors influencing demand.